The analysis of the interaction of demand and supply is useful to determine the equilibrium market price and quantity. When the price is rs.9 per kg of rice, the difference between market demand and market supply is 900 tonnes and this unsold stock would put downward pressure on price and hence the sellers will reduce it to rs.8.50per kg. Now, the demand would rise to 300 tonnes and supply would reduce to 800 tonnes. Still, there is excess supply over demand and this would again reduce the price. The process continues until the price settles at Rs.7.50 per kg, which is the equilibrium price. At the equilibrium price, the forces of demand and supply are balanced (at 500 tonnes per day) i.e., the market demand is equal to market supply and buyers and sellers are satisfied.
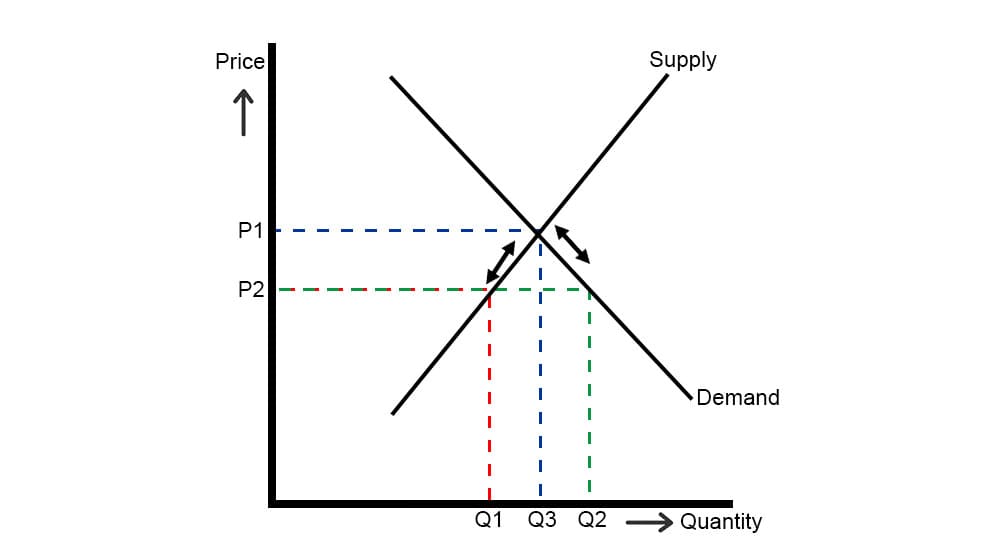
Fig: Market equilibrium
Table: Market Demand and Supply Schedules for Rice
Price (Rs./kg) Market demand (Tonnes/day) Market supply(Tonnes/day)
9.00 100 1000
8.50 300 800
8.00 400 600
7.50 500 500
7.00 700 400
6.50 1000 200